

Traces
Tracing is a fundamental component of the Strands SDK’s observability framework, providing detailed insights into your agent’s execution. Using the OpenTelemetry standard, Strands traces capture the complete journey of a request through your agent, including LLM interactions, retrievers, tool usage, and event loop processing.
Understanding Traces in Strands
Section titled “Understanding Traces in Strands”Traces in Strands provide a hierarchical view of your agent’s execution, allowing you to:
- Track the entire agent lifecycle: From initial prompt to final response
- Monitor individual LLM calls: Examine prompts, completions, and token usage
- Analyze tool execution: Understand which tools were called, with what parameters, and their results
- Measure performance: Identify bottlenecks and optimization opportunities
- Debug complex workflows: Follow the exact path of execution through multiple cycles
Each trace consists of multiple spans that represent different operations in your agent’s execution flow:
+-------------------------------------------------------------------------------------+| Strands Agent || - gen_ai.system: <system name> || - gen_ai.agent.name: <agent name> || - gen_ai.operation.name: <operation> || - gen_ai.request.model: <model identifier> || - gen_ai.event.start_time: <timestamp> || - gen_ai.event.end_time: <timestamp> || - gen_ai.user.message: <user query> || - gen_ai.choice: <agent response> || - gen_ai.usage.prompt_tokens: <number> || - gen_ai.usage.input_tokens: <number> || - gen_ai.usage.completion_tokens: <number> || - gen_ai.usage.output_tokens: <number> || - gen_ai.usage.total_tokens: <number> || - gen_ai.usage.cache_read_input_tokens: <number> || - gen_ai.usage.cache_write_input_tokens: <number> || || +-------------------------------------------------------------------------------+ || | Cycle <cycle-id> | || | - gen_ai.user.message: <formatted prompt> | || | - gen_ai.assistant.message: <formatted prompt> | || | - event_loop.cycle_id: <cycle identifier> | || | - gen_ai.event.end_time: <timestamp> | || | - gen_ai.choice | || | - tool.result: <tool result data> | || | - message: <formatted completion> | || | | || | +-----------------------------------------------------------------------+ | || | | Model invoke | | || | | - gen_ai.system: <system name> | | || | | - gen_ai.operation.name: <operation> | | || | | - gen_ai.user.message: <formatted prompt> | | || | | - gen_ai.assistant.message: <formatted prompt> | | || | | - gen_ai.request.model: <model identifier> | | || | | - gen_ai.event.start_time: <timestamp> | | || | | - gen_ai.event.end_time: <timestamp> | | || | | - gen_ai.choice: <model response with tool use> | | || | | - gen_ai.usage.prompt_tokens: <number> | | || | | - gen_ai.usage.input_tokens: <number> | | || | | - gen_ai.usage.completion_tokens: <number> | | || | | - gen_ai.usage.output_tokens: <number> | | || | | - gen_ai.usage.total_tokens: <number> | | || | | - gen_ai.usage.cache_read_input_tokens: <number> | | || | | - gen_ai.usage.cache_write_input_tokens: <number> | | || | +-----------------------------------------------------------------------+ | || | | || | +-----------------------------------------------------------------------+ | || | | Tool: <tool name> | | || | | - gen_ai.event.start_time: <timestamp> | | || | | - gen_ai.operation.name: <operation> | | || | | - gen_ai.tool.name: <tool name> | | || | | - gen_ai.tool.call.id: <tool use identifier> | | || | | - gen_ai.event.end_time: <timestamp> | | || | | - gen_ai.choice: <tool execution result> | | || | | - tool.status: <execution status> | | || | +-----------------------------------------------------------------------+ | || +-------------------------------------------------------------------------------+ |+-------------------------------------------------------------------------------------+OpenTelemetry Integration
Section titled “OpenTelemetry Integration”Strands natively integrates with OpenTelemetry, an industry standard for distributed tracing. This integration provides:
- Compatibility with existing observability tools: Send traces to platforms like Jaeger, Grafana Tempo, AWS X-Ray, Datadog, and more
- Standardized attribute naming: Using the OpenTelemetry semantic conventions
- Flexible export options: Console output for development, OTLP endpoint for production
- Auto-instrumentation: Trace creation is handled automatically when you enable tracing
Enabling Tracing
Section titled “Enabling Tracing”Environment Variables
Section titled “Environment Variables”# Specify custom OTLP endpointexport OTEL_EXPORTER_OTLP_ENDPOINT="http://collector.example.com:4318"
# Set Default OTLP Headersexport OTEL_EXPORTER_OTLP_HEADERS="key1=value1,key2=value2"
# To use OTEL latest semantic conventions, and send tool defenitions as spansexport OTEL_SEMCONV_STABILITY_OPT_IN="gen_ai_latest_experimental,gen_ai_tool_definitions"Code Configuration
Section titled “Code Configuration”from strands import Agent
# Option 1: Skip StrandsTelemetry if global tracer provider and/or meter provider are already configured# (your existing OpenTelemetry setup will be used automatically)agent = Agent( model="us.anthropic.claude-sonnet-4-20250514-v1:0", system_prompt="You are a helpful AI assistant")
# Option 2: Use StrandsTelemetry to handle complete OpenTelemetry setup# (Creates new tracer provider and sets it as global)from strands.telemetry import StrandsTelemetry
strands_telemetry = StrandsTelemetry()strands_telemetry.setup_otlp_exporter() # Send traces to OTLP endpointstrands_telemetry.setup_console_exporter() # Print traces to consolestrands_telemetry.setup_meter( enable_console_exporter=True, enable_otlp_exporter=True) # Setup new meter provider and sets it as global
# Option 3: Use StrandsTelemetry with your own tracer provider# (Keeps your tracer provider, adds Strands exporters without setting global)from strands.telemetry import StrandsTelemetry
strands_telemetry = StrandsTelemetry(tracer_provider=user_tracer_provider)strands_telemetry.setup_meter(enable_otlp_exporter=True)strands_telemetry.setup_otlp_exporter().setup_console_exporter() # Chaining supported
# Create agent (tracing will be enabled automatically)agent = Agent( model="us.anthropic.claude-sonnet-4-20250514-v1:0", system_prompt="You are a helpful AI assistant")
# Use agent normallyresponse = agent("What can you help me with?")import { Agent } from '@strands-agents/sdk'
// Option 1: Skip setupTracer() if a global tracer provider is already configured// (your existing OpenTelemetry setup will be used automatically)const agent = new Agent({ systemPrompt: 'You are a helpful AI assistant',})
import { Agent } from '@strands-agents/sdk'import { setupTracer } from '@strands-agents/sdk/telemetry'
// Option 2: Use setupTracer() to handle complete OpenTelemetry setup// (creates a new tracer provider and registers it as global)setupTracer({ exporters: { otlp: true, console: true }, // Send traces to OTLP endpoint and console debug})
import { Agent } from '@strands-agents/sdk'import { setupTracer } from '@strands-agents/sdk/telemetry'import { NodeTracerProvider } from '@opentelemetry/sdk-trace-node'
// Option 3: Use setupTracer() with your own tracer providerconst provider = new NodeTracerProvider()setupTracer({ provider, exporters: { otlp: true, console: true },})
// Create agent (tracing will be enabled automatically)const agent = new Agent({ systemPrompt: 'You are a helpful AI assistant',})
// Use agent normallyconst result = await agent.invoke('What can you help me with?')Trace Structure
Section titled “Trace Structure”Strands creates a hierarchical trace structure that mirrors the execution of your agent:
-
Agent Span: The top-level span representing the entire agent invocation
- Contains overall metrics like total token usage and cycle count
- Captures the user prompt and final response
-
Cycle Spans: Child spans for each event loop cycle
- Tracks the progression of thought and reasoning
- Shows the transformation from prompt to response
-
LLM Spans: Model invocation spans
- Contains prompt, completion, and token usage
- Includes model-specific parameters
-
Tool Spans: Tool execution spans
- Captures tool name, parameters, and results
- Measures tool execution time
Captured Attributes
Section titled “Captured Attributes”Strands traces include rich attributes that provide context for each operation:
Agent-Level Attributes
Section titled “Agent-Level Attributes”| Attribute | Description |
|-----------|-------------|
| gen_ai.system | The agent system identifier (“strands-agents”) |
| gen_ai.agent.name | Name of the agent |
| gen_ai.user.message | The user’s initial prompt |
| gen_ai.choice | The agent’s final response |
| system_prompt | System instructions for the agent |
| gen_ai.request.model | Model ID used by the agent |
| gen_ai.event.start_time | When agent processing began |
| gen_ai.event.end_time | When agent processing completed |
| gen_ai.usage.prompt_tokens | Total tokens used for prompts |
| gen_ai.usage.input_tokens | Total tokens used for prompts (duplicate) |
| gen_ai.usage.completion_tokens | Total tokens used for completions |
| gen_ai.usage.output_tokens | Total tokens used for completions (duplicate) |
| gen_ai.usage.total_tokens | Total token usage |
| gen_ai.usage.cache_read_input_tokens | Number of input tokens read from cache (Note: Not all model providers support cache tokens. This defaults to 0 in that case) |
| gen_ai.usage.cache_write_input_tokens | Number of input tokens written to cache (Note: Not all model providers support cache tokens. This defaults to 0 in that case) |
Cycle-Level Attributes
Section titled “Cycle-Level Attributes”| Attribute | Description |
|-----------|-------------|
| event_loop.cycle_id | Unique identifier for the reasoning cycle |
| gen_ai.user.message | The user’s initial prompt |
| gen_ai.assistant.message | Formatted prompt for this reasoning cycle |
| gen_ai.event.end_time | When the cycle completed |
| gen_ai.choice.message | Model’s response for this cycle |
| gen_ai.choice.tool.result | Results from tool calls (if any) |
Model Invoke Attributes
Section titled “Model Invoke Attributes”| Attribute | Description |
|-----------|-------------|
| gen_ai.system | The agent system identifier |
| gen_ai.operation.name | Gen-AI operation name |
| gen_ai.agent.name | Name of the agent |
| gen_ai.user.message | Formatted prompt sent to the model |
| gen_ai.assistant.message | Formatted assistant prompt sent to the model |
| gen_ai.request.model | Model ID (e.g., “us.anthropic.claude-sonnet-4-20250514-v1:0”) |
| gen_ai.event.start_time | When model invocation began |
| gen_ai.event.end_time | When model invocation completed |
| gen_ai.choice | Response from the model (may include tool calls) |
| gen_ai.usage.prompt_tokens | Total tokens used for prompts |
| gen_ai.usage.input_tokens | Total tokens used for prompts (duplicate) |
| gen_ai.usage.completion_tokens | Total tokens used for completions |
| gen_ai.usage.output_tokens | Total tokens used for completions (duplicate) |
| gen_ai.usage.total_tokens | Total token usage |
| gen_ai.usage.cache_read_input_tokens | Number of input tokens read from cache (Note: Not all model providers support cache tokens. This defaults to 0 in that case) |
| gen_ai.usage.cache_write_input_tokens | Number of input tokens written to cache (Note: Not all model providers support cache tokens. This defaults to 0 in that case) |
Tool-Level Attributes
Section titled “Tool-Level Attributes”| Attribute | Description |
|-----------|-------------|
| tool.status | Execution status (success/error) |
| gen_ai.tool.name | Name of the tool called |
| gen_ai.tool.call.id | Unique identifier for the tool call |
| gen_ai.operation.name | Gen-AI operation name |
| gen_ai.event.start_time | When tool execution began |
| gen_ai.event.end_time | When tool execution completed |
| gen_ai.choice | Formatted tool result |
Visualization and Analysis
Section titled “Visualization and Analysis”Traces can be visualized and analyzed using any OpenTelemetry-compatible tool:
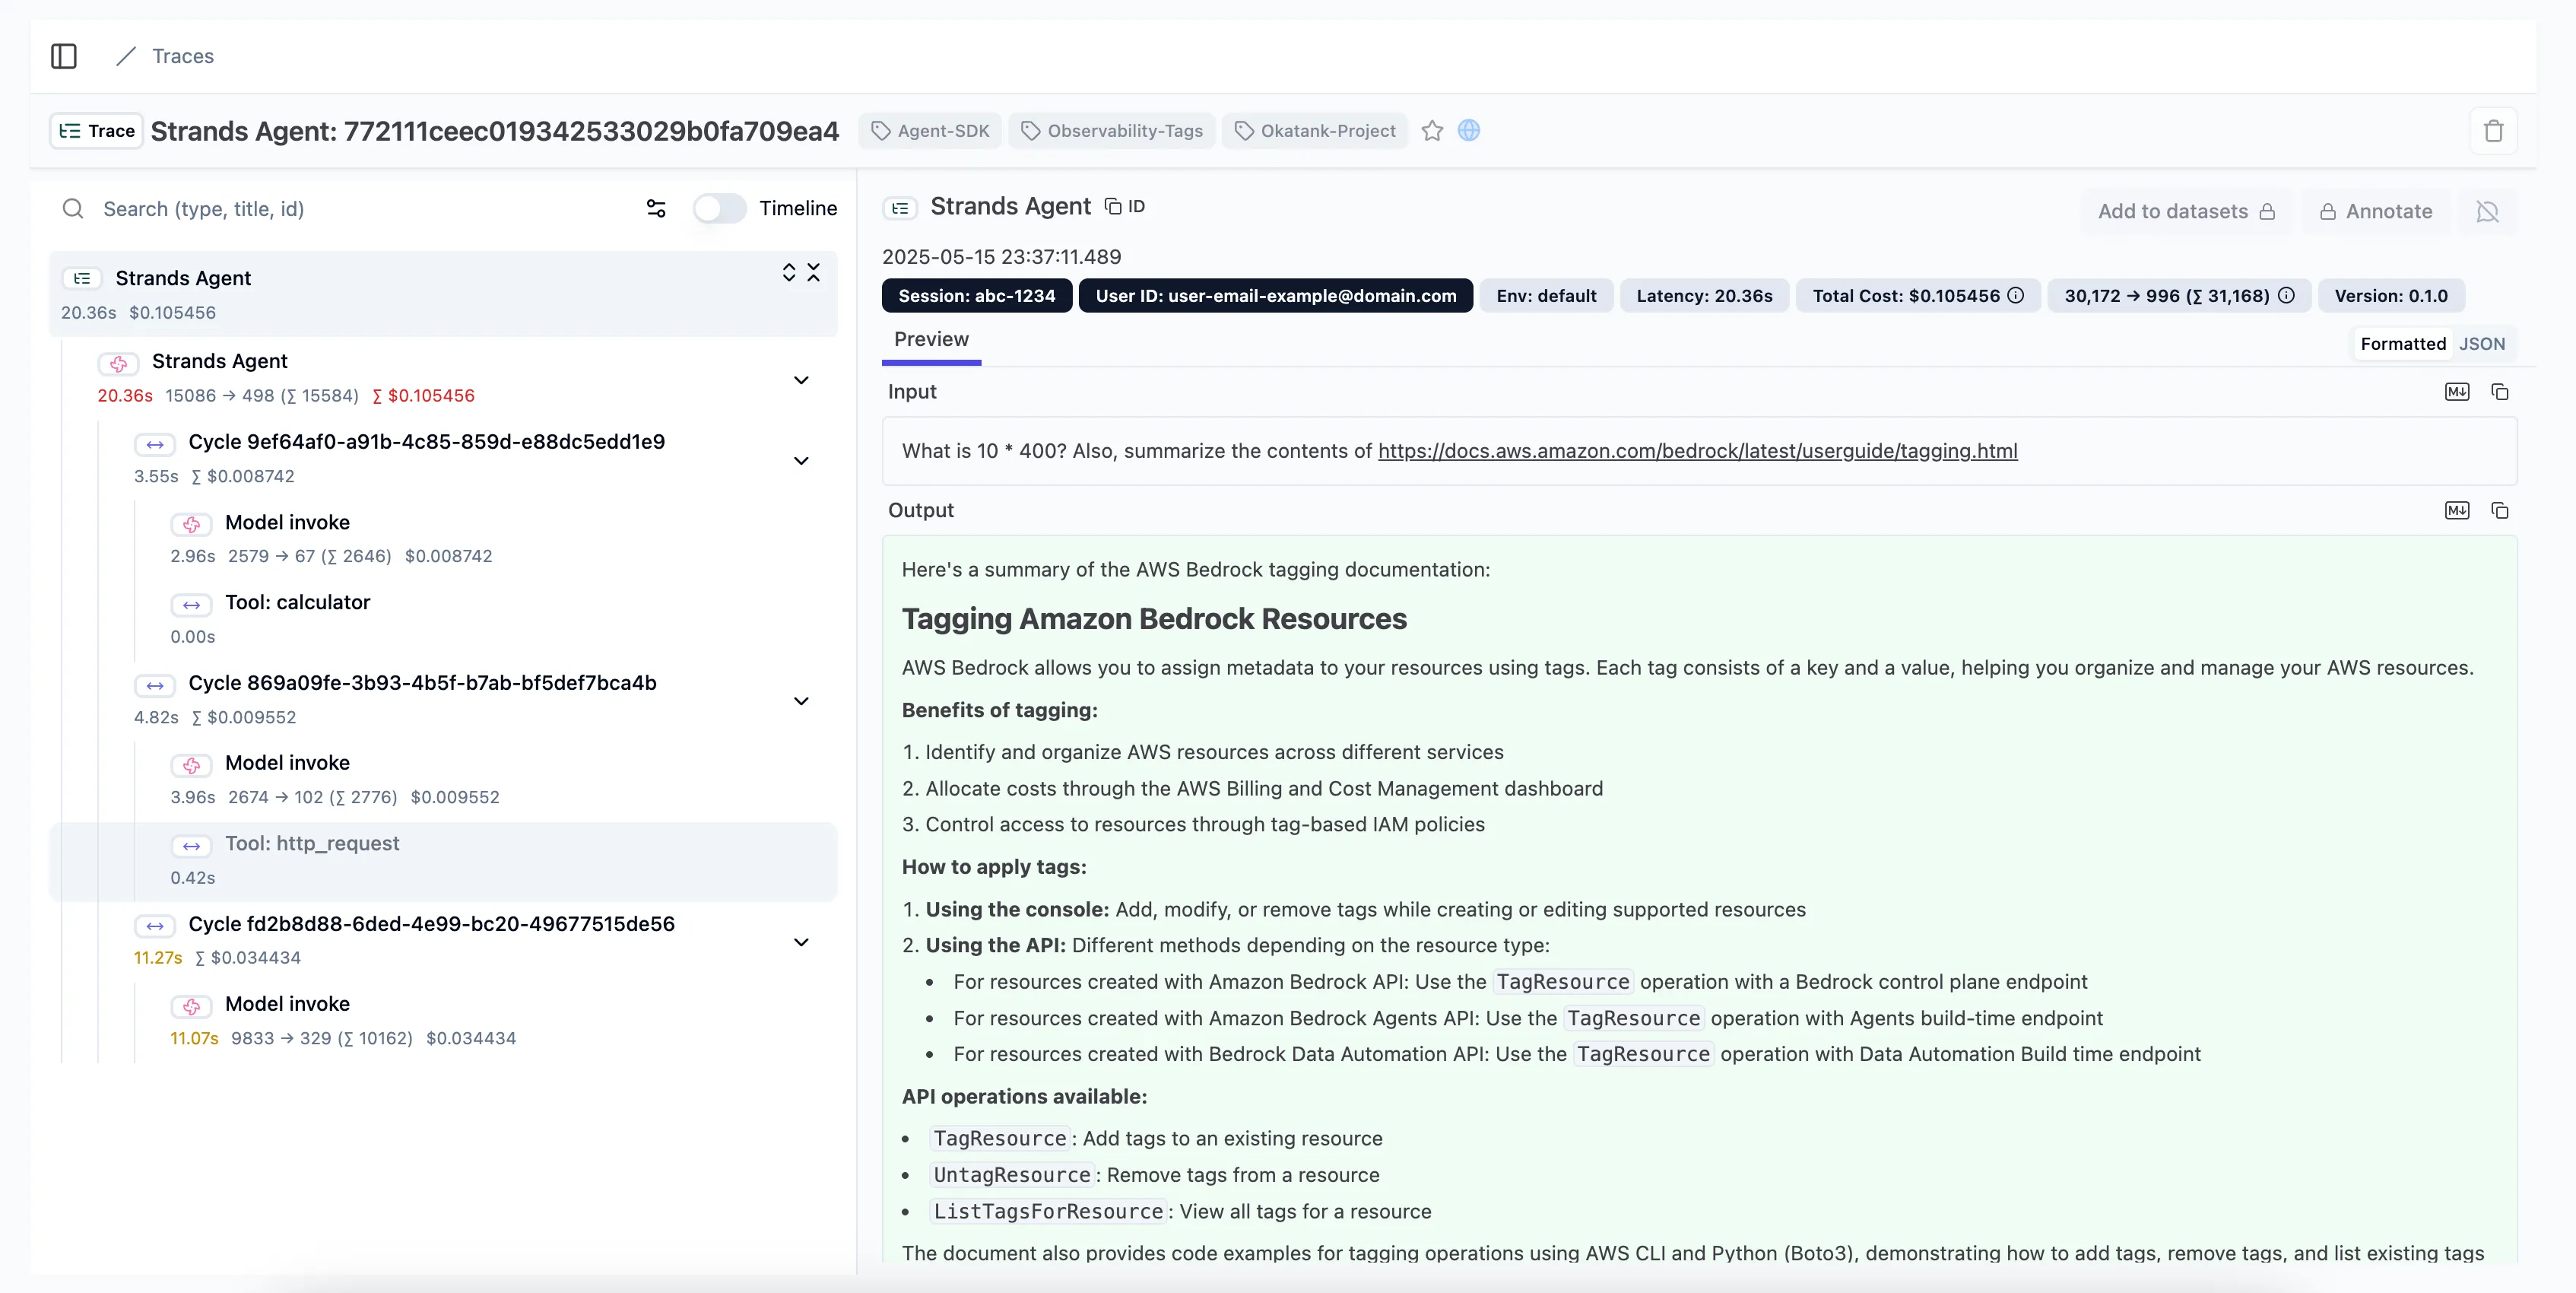
Common visualization options include:
- Jaeger: Open-source, end-to-end distributed tracing
- Langfuse: For Traces, evals, prompt management, and metrics
- AWS X-Ray: For AWS-based applications
- Zipkin: Lightweight distributed tracing
- Opik: For evaluating and optimizing multi-agent systems
Local Development Setup
Section titled “Local Development Setup”For development environments, you can quickly set up a local collector and visualization:
# Pull and run Jaeger all-in-one containerdocker run -d --name jaeger \ -e COLLECTOR_ZIPKIN_HOST_PORT=:9411 \ -e COLLECTOR_OTLP_ENABLED=true \ -p 6831:6831/udp \ -p 6832:6832/udp \ -p 5778:5778 \ -p 16686:16686 \ -p 4317:4317 \ -p 4318:4318 \ -p 14250:14250 \ -p 14268:14268 \ -p 14269:14269 \ -p 9411:9411 \ jaegertracing/all-in-one:latestThen access the Jaeger UI at http://localhost:16686 to view your traces.
You can also setup console export to inspect the spans:
from strands.telemetry import StrandsTelemetry
StrandsTelemetry().setup_console_exporter()
import { setupTracer } from '@strands-agents/sdk/telemetry'
setupTracer({ exporters: { console: true },})Advanced Configuration
Section titled “Advanced Configuration”Sampling Control
Section titled “Sampling Control”For high-volume applications, you may want to implement sampling to reduce the volume of data to do this you can utilize the default Open Telemetry Environment variables:
# Example: Sample 50% of tracesexport OTEL_TRACES_SAMPLER="traceidratio"export OTEL_TRACES_SAMPLER_ARG="0.5"Custom Attribute Tracking
Section titled “Custom Attribute Tracking”You can add custom attributes to any span:
agent = Agent( system_prompt="You are a helpful assistant that provides concise responses.", tools=[http_request, calculator], trace_attributes={ "session.id": "abc-1234", "user.id": "user-email-example@domain.com", "tags": [ "Agent-SDK", "Okatank-Project", "Observability-Tags", ] },)import { Agent } from '@strands-agents/sdk'
const agent = new Agent({ systemPrompt: 'You are a helpful assistant that provides concise responses.', traceAttributes: { 'session.id': 'abc-1234', 'user.id': 'user-email-example@domain.com', tags: ['Agent-SDK', 'Okatank-Project', 'Observability-Tags'], },})Custom Spans
Section titled “Custom Spans”You can access the configured tracer to create your own custom spans alongside the auto-instrumented ones:
from opentelemetry import trace
# Get your configured tracer to optionally create your own custom spanstracer = trace.get_tracer(__name__)with tracer.start_as_current_span("my-custom-operation") as span:    span.set_attribute("custom.key", "value")    # ... do work ...
import { setupTracer, getTracer } from '@strands-agents/sdk/telemetry'
// Set up telemetry first (or register your own NodeTracerProvider)setupTracer({ exporters: { otlp: true } })
// Get a tracer and create custom spansconst tracer = getTracer()const span = tracer.startSpan('my-custom-operation')span.setAttribute('custom.key', 'value')// ... do work ...span.end()Configuring the exporters from source code
Section titled “Configuring the exporters from source code”The StrandsTelemetry().setup_console_exporter() and StrandsTelemetry().setup_otlp_exporter() methods accept keyword arguments that are passed to OpenTelemetry’s ConsoleSpanExporter and OTLPSpanExporter initializers, respectively. This allows you to save the log lines to a file or set up the OTLP endpoints from Python code:
from os import linesepfrom strands.telemetry import StrandsTelemetry
strands_telemetry = StrandsTelemetry()
# Save telemetry to a local file and configure the serialization formatlogfile = open("my_log.jsonl", "wt")strands_telemetry.setup_console_exporter(    out=logfile,    formatter=lambda span: span.to_json() + linesep,)# ... your agent-running code goes here ...logfile.close()
# Configure OTLP endpoints programmaticallystrands_telemetry.setup_otlp_exporter(    endpoint="http://collector.example.com:4318",    headers={"key1": "value1", "key2": "value2"},)
For more information about the accepted arguments, refer to ConsoleSpanExporter and OTLPSpanExporter in the OpenTelemetry API documentation.
The telemetry.setupTracer() function reads OTLP configuration from standard OpenTelemetry environment variables (OTEL_EXPORTER_OTLP_ENDPOINT, OTEL_EXPORTER_OTLP_HEADERS). For full control over exporter configuration, provide your own NodeTracerProvider:
import { setupTracer } from '@strands-agents/sdk/telemetry'import { NodeTracerProvider } from '@opentelemetry/sdk-trace-node'import {  BatchSpanProcessor,  SimpleSpanProcessor,  ConsoleSpanExporter,} from '@opentelemetry/sdk-trace-base'import { OTLPTraceExporter } from '@opentelemetry/exporter-trace-otlp-http'
const provider = new NodeTracerProvider({  spanProcessors: [    // Configure OTLP endpoint programmatically    new BatchSpanProcessor(      new OTLPTraceExporter({        url: 'http://collector.example.com:4318/v1/traces',        headers: { key1: 'value1', key2: 'value2' },      })    ),    // Add console exporter for debugging    new SimpleSpanProcessor(new ConsoleSpanExporter()),  ],})
// Register the provider with StrandssetupTracer({ provider })
For more information about the accepted arguments, refer to the OpenTelemetry JS documentation.
Best Practices
Section titled “Best Practices”- Use appropriate detail level: Balance between capturing enough information and avoiding excessive data
- Add business context: Include business-relevant attributes like customer IDs or transaction values
- Implement sampling: For high-volume applications, use sampling to reduce data volume
- Secure sensitive data: Avoid capturing PII or sensitive information in traces
- Correlate with logs and metrics: Use trace IDs to link traces with corresponding logs
- Monitor storage costs: Be aware of the data volume generated by traces
Common Issues and Solutions
Section titled “Common Issues and Solutions”| Issue | Solution | |-------|----------| | Missing traces | Check that your collector endpoint is correct and accessible | | Excessive data volume | Implement sampling or filter specific span types | | Incomplete traces | Ensure all services in your workflow are properly instrumented | | High latency | Consider using batching and asynchronous export | | Missing context | Use context propagation to maintain trace context across services |
Example: End-to-End Tracing
Section titled “Example: End-to-End Tracing”This example demonstrates capturing a complete trace of an agent interaction:
from strands import Agentfrom strands.telemetry import StrandsTelemetryimport os
os.environ["OTEL_EXPORTER_OTLP_ENDPOINT"] = "http://localhost:4318"strands_telemetry = StrandsTelemetry()strands_telemetry.setup_otlp_exporter()      # Send traces to OTLP endpointstrands_telemetry.setup_console_exporter()   # Print traces to console
# Create agentagent = Agent(    model="us.anthropic.claude-sonnet-4-20250514-v1:0",    system_prompt="You are a helpful AI assistant")
# Execute a series of interactions that will be tracedresponse = agent("Find me information about Mars. What is its atmosphere like?")print(response)
# Ask a follow-up that uses toolsresponse = agent("Calculate how long it would take to travel from Earth to Mars at 100,000 km/h")print(response)
# Each interaction creates a complete trace that can be visualized in your tracing tool
import { Agent } from '@strands-agents/sdk'import { setupTracer } from '@strands-agents/sdk/telemetry'
// Set environment variables for OTLP endpointprocess.env.OTEL_EXPORTER_OTLP_ENDPOINT = 'http://localhost:4318'
// Configure telemetrysetupTracer({ exporters: { otlp: true, console: true },})
// Create agentconst agent = new Agent({ systemPrompt: 'You are a helpful AI assistant',})
// Execute interactions that will be tracedconst response = await agent.invoke( 'Find me information about Mars. What is its atmosphere like?')console.log(response)
// Each interaction creates a complete trace that can be visualized in your tracing toolSending traces to CloudWatch X-ray
Section titled “Sending traces to CloudWatch X-ray”There are several ways to send traces, metrics, and logs to CloudWatch. Please visit the following pages for more details and configurations:
- Please ensure Transaction Search is enabled in CloudWatch.